Fish Stocked in the Great Lakes
Data Description
- The source of the data is from the Tidy Tuesday package that has data on fish stocking in the Great Lakes found from the Great Lakes Fishery Commission 1867-2015.
- The data includes variables such as the year, month, lake, species, state, and number of fish stocked.
- The research questions I would like to address includes Which lakes get stocked the most and do the species of fish differ by each lake? The second question is Has the number of fish stocked changed over the years and is there a seasonal difference?
Data Visualization
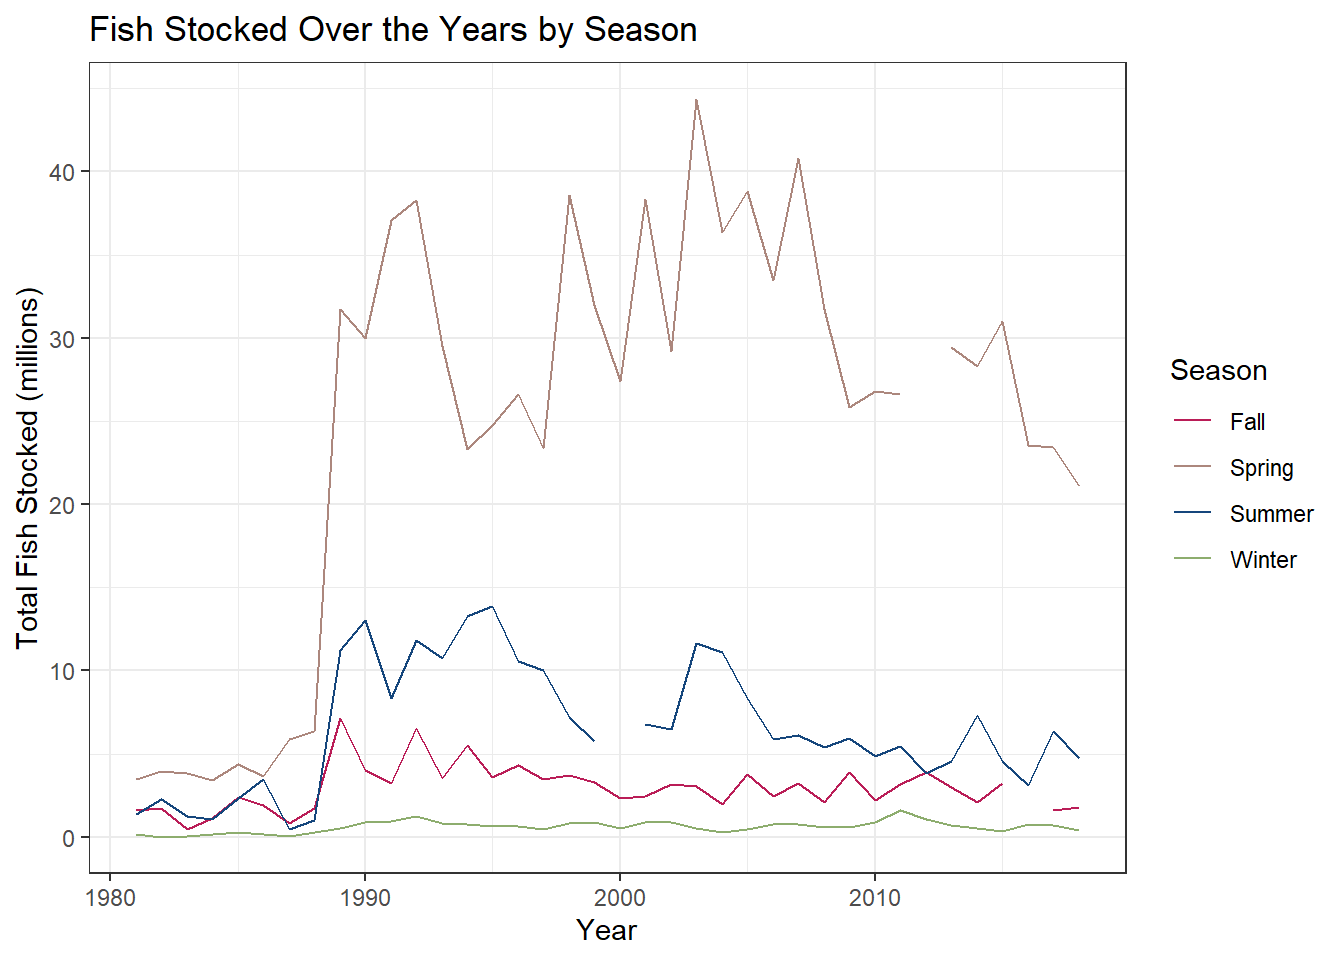
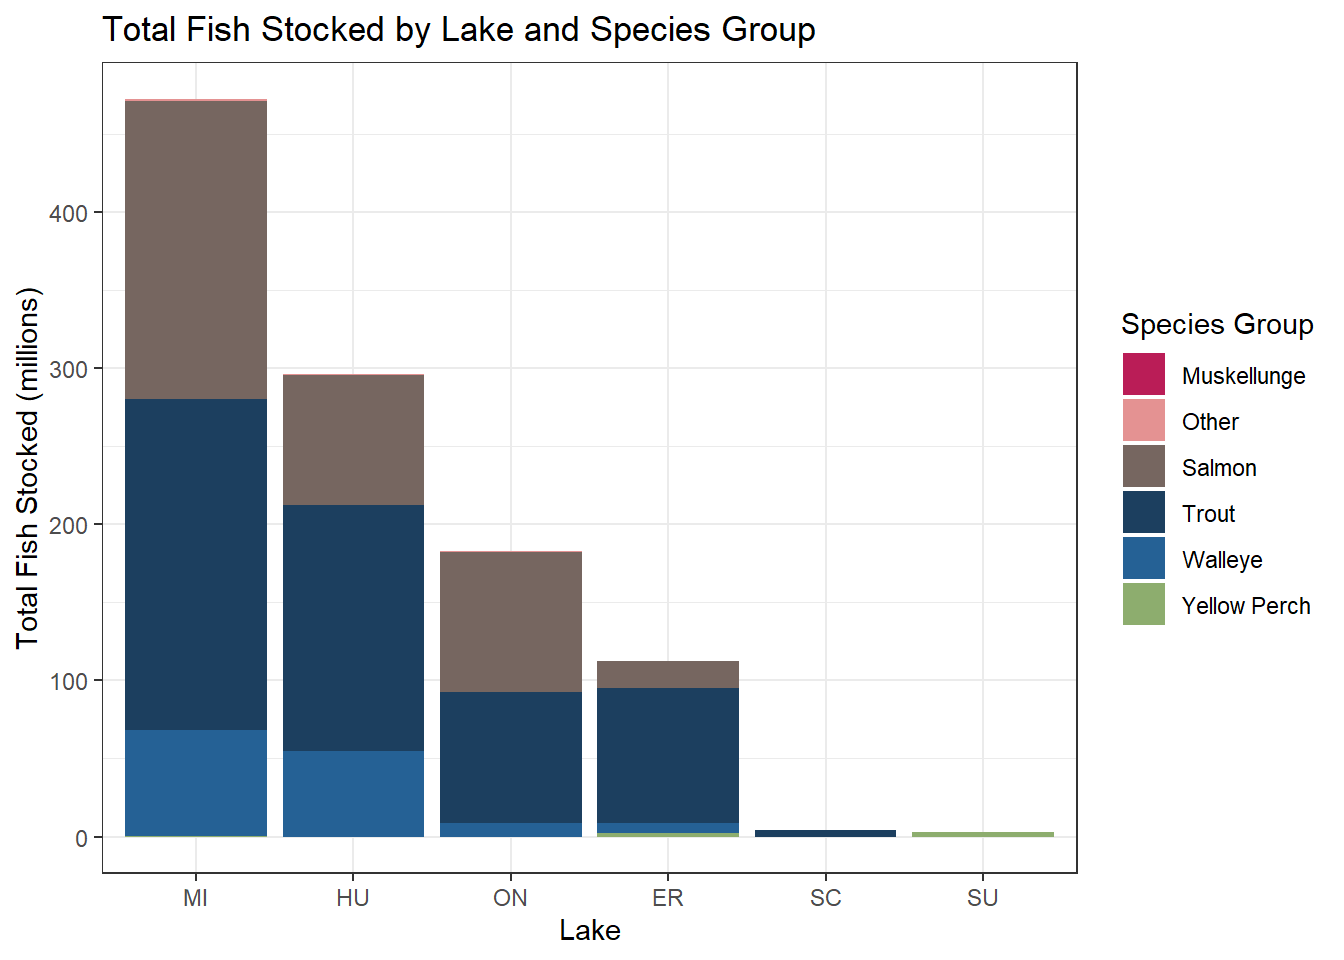
I want my final visualizations to show the trends over time using a line plot and highlight each of the seasons using different lines. I would like another visualization to show the number of fish stocked for each lake using something like a bar chart that highlights each of the species types.
Data Cleaning
- I need to create a season variable by grouping the months into each of the 4 seasons.
- I need to remove a couple of variables that I am not interested in.
- I would also need to filter out the N/A values that are missing in the months variable for when I am creating seasons.
Visualization 1
Visualization 2